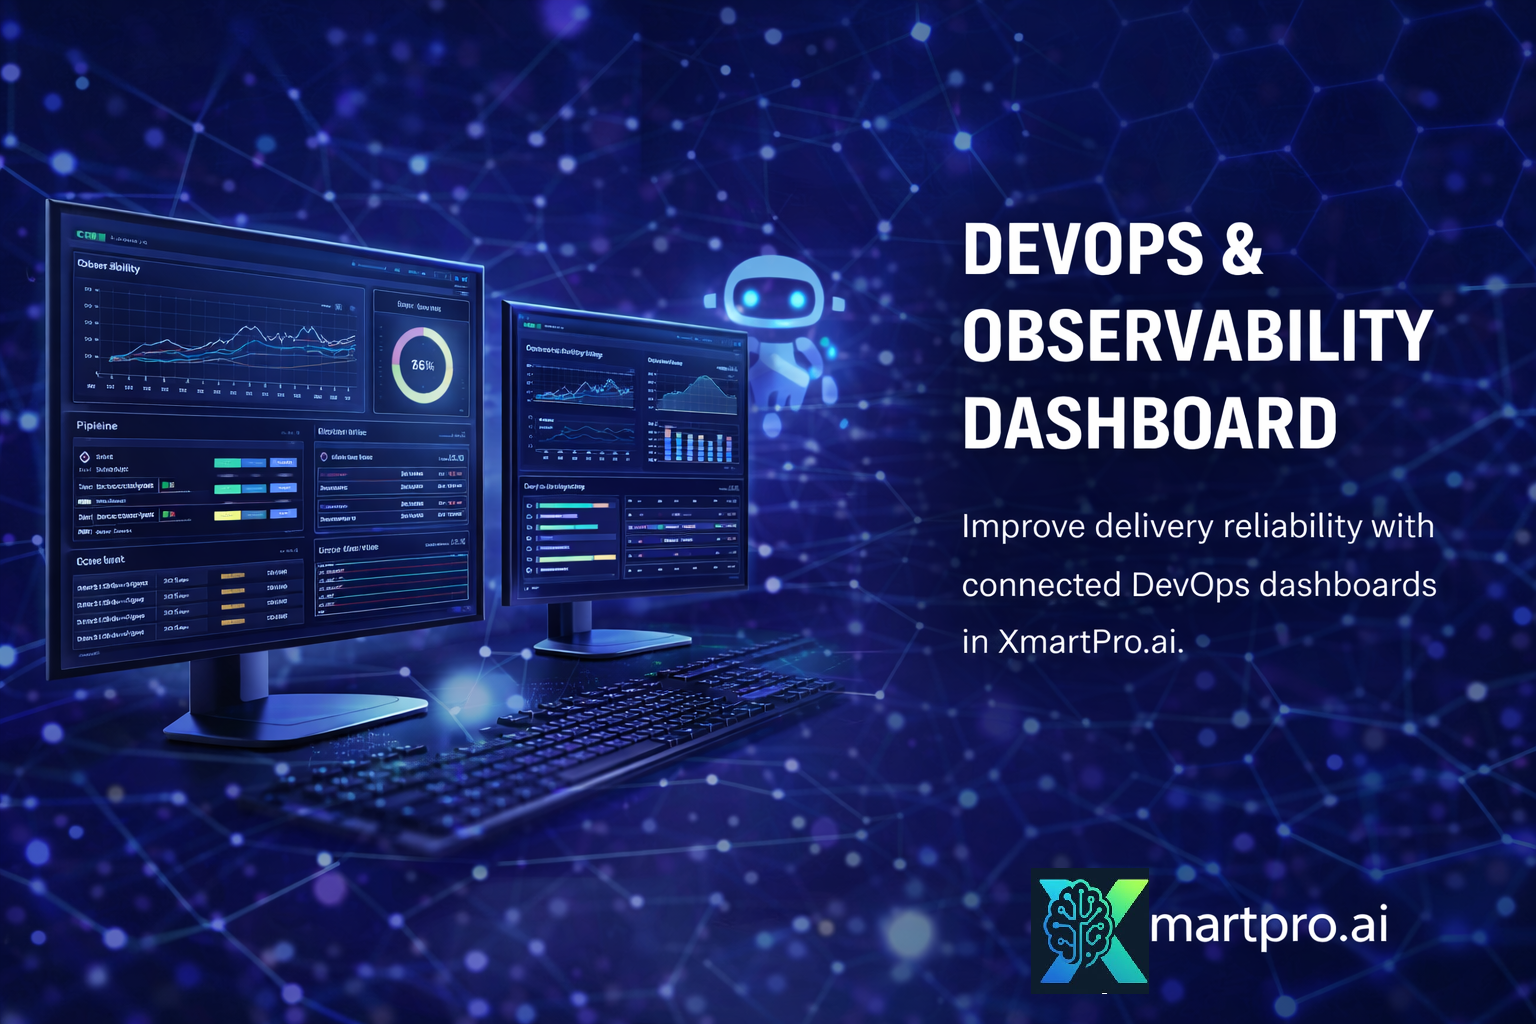
XmartPro.ai’s DevOps & Observability Dashboard is your operational command center—built to connect delivery to reality so you ship responsibly. Instead of treating monitoring as a separate world, this dashboard ties services, incidents, deployments, and customer impact back to the exact epics and releases that changed the system. Leaders get a clear health snapshot; engineers get actionable signals; product teams see what reliability means for the user journey. The AI Copilot summarizes what’s happening right now, what changed recently, and what requires attention—turning noisy telemetry into prioritized work with ownership, due dates, and measurable outcomes.
Monitoring and observability signals come first: availability, latency, error rates, SLO/SLA status, alert volume, and incident severity trends. XmartPro organizes signals by service, environment, tenant, and customer journey, so teams can spot “where it hurts” quickly. When an alert fires, you can link it to an incident, then map that incident to impacted features, user stories, and recent changes. Copilot clusters related alerts, identifies repeating patterns, drafts an incident summary, and suggests next steps (roll back, feature-flag off, hotfix, or investigate). Post-incident, it generates corrective actions and prevents repeat failures by converting learnings into backlog items and knowledge articles.
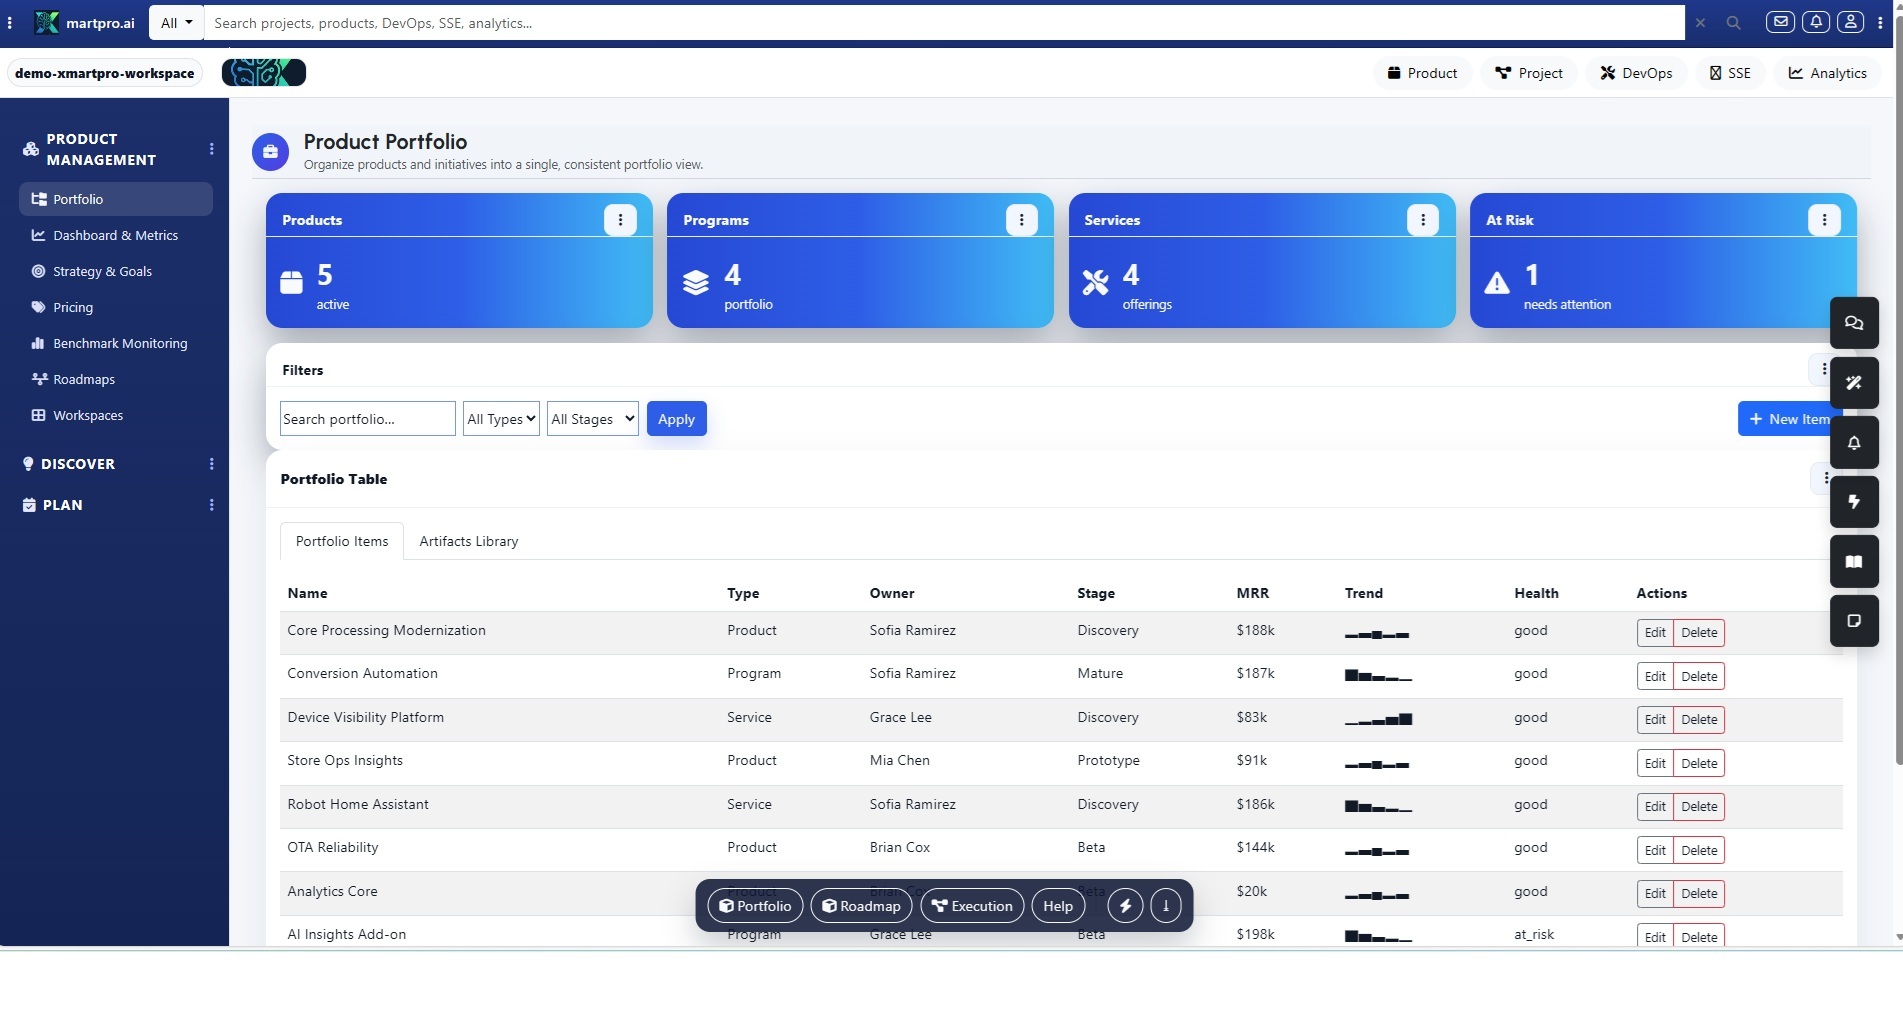
Pipeline and deployment visibility keeps releases honest. Track build status, test results, deployment progress, feature flags, canary rollouts, and rollback readiness—per service and per release. See what is blocked by approvals, what failed in staging, and what is safe to promote. XmartPro can show a release timeline that correlates deployments to metric shifts, helping teams answer the hardest question fast: “Did this release cause the spike?” Copilot summarizes failed pipelines, explains common failure causes, and generates a release readiness report for change windows. This reduces late-night surprises, shortens recovery cycles, and gives stakeholders a single source of truth for what shipped and why.
Security and compliance checkpoints are embedded in the dashboard so “secure by default” becomes operational, not theoretical. Define gates for dependency scanning, secrets detection, SBOM references, approvals, and change records, then verify completion before promotion to production. For regulated environments, capture evidence: test runs, sign-offs, risk exceptions, and expiration dates. Copilot flags missing controls, summarizes risk posture by release, and drafts compliance-ready release notes so audits don’t turn into fire drills. Teams can track vulnerabilities by severity, map them to affected services and releases, and create remediation epics with measurable deadlines and owner accountability.
Cost and performance insights tie engineering choices to business impact. Track cloud spend, utilization, unit economics (cost per transaction/device/tenant), and performance budgets (latency targets, error budgets) alongside each release. The dashboard highlights cost regressions, performance deltas, and capacity risks immediately after deployment, so optimization becomes part of the release loop. Copilot proposes experiments, prioritizes fixes by ROI, and converts insights into work items that feed your roadmap. The outcome is a disciplined system where product, engineering, and ops share one scoreboard—and every release improves reliability, security, and cost-to-serve while protecting the customer experience.